Rotational Diagrams: Organizing Information in Circles

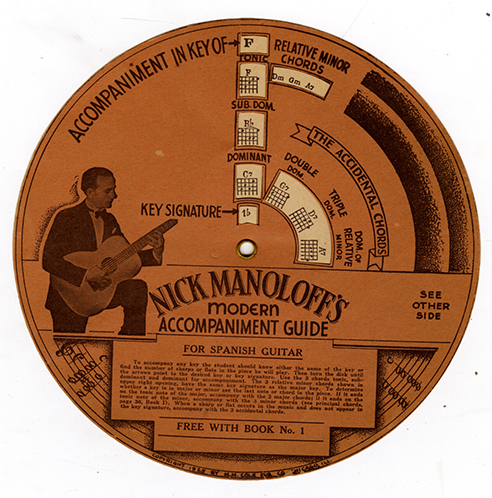
In Reinventing the Wheel, writer, design critic, and Design Observer co-founder Jessica Helfand considers the rich history of rotational diagrams — the wheel as a visual metaphor and an interactive tool for representing and understanding information, predating print by thousands of years.


wheel_manoloff_guitar


wheel_presidents


Source: Maria Popova, Brain Pickings


About GilPress

I launched the Big Data conversation; writing, research, marketing services; http://whatsthebigdata.com/ & https://infostory.com/
This entry was posted in information organization, Information Visualization. Bookmark the permalink.

Leave a Reply

Fill in your details below or click an icon to log in:

WordPress.com Logo

You are commenting using your WordPress.com account. Log Out /  Change )

Facebook photo

You are commenting using your Facebook account. Log Out /  Change )

Connecting to %s