
Caitlin Rosenthal writes in “Big Data in the Age of the Telegraph,” McKinsey Quarterly, March 2013:
“In 1854, Daniel McCallum took charge of the operations of the New York and Erie Railroad. With nearly 500 miles of track, it was one of the world’s longest systems, but not one of the most efficient. In fact, McCallum found that far from rendering operations more efficient, the scale of the railroad exponentially increased its complexity.
The problem was not a lack of information: the growing use of the telegraph gave the company an unprecedented supply of nearly real-time data, including reports of accidents and train delays. Rather, the difficulty was putting that data to use, and it led McCallum to develop one of the era’s great low-tech management innovations: the organization chart…

Insert #1:
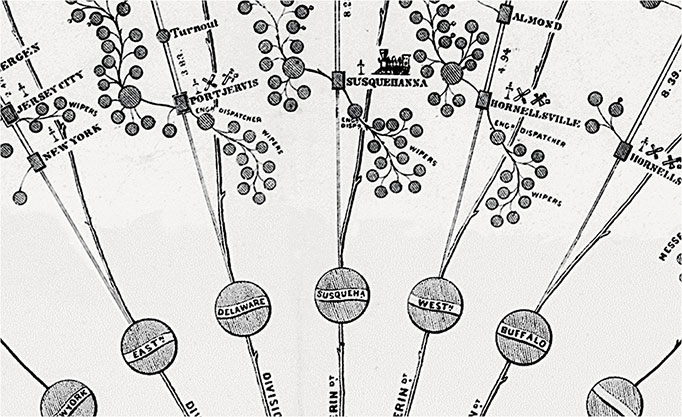
In crafting the organizational plan, McCallum sought to improve the way the railroad used information. Through 21st-century eyes, the chart looks both antiquarian and surprisingly modern. Far from the static, hierarchical pyramids that we today associate with such charts, his was modeled after a tree. McCallum drew the board of directors as the roots, himself and his chief officers as the tree’s trunk, and the railroad’s divisions and departments as the branches.
Critically, McCallum gained control by giving up control, delegating authority to managers who could use information in real time. He put what we would call the organization’s C-level at the ground level, supporting the railroad, not directing its operations. Following one of McCallum’s key precepts—“a proper division of responsibilities”—authority over day-to-day scheduling went to the divisional superintendents down the line…
Drowning in the details of operations, Daniel McCallum stepped back and redesigned the railroad’s organization. His insights on how to meld local authority with information gave his managers better operating tools—which are just as relevant in the age of the Internet as they were in the age of the telegraph.”
